Inside the Social Graph: Decoding Digital Connections
Every digital interaction, whether it’s a follow, a mention, a shared post, or something else, adds a thread to the web of online relationships. Together, these threads form what analysts call a social graph—a network that maps how people, accounts, and organizations connect across social media platforms. In cyber threat intelligence and OSINT, such graphs are key to revealing how influence spreads, narratives evolve, and coordinated campaigns take shape.
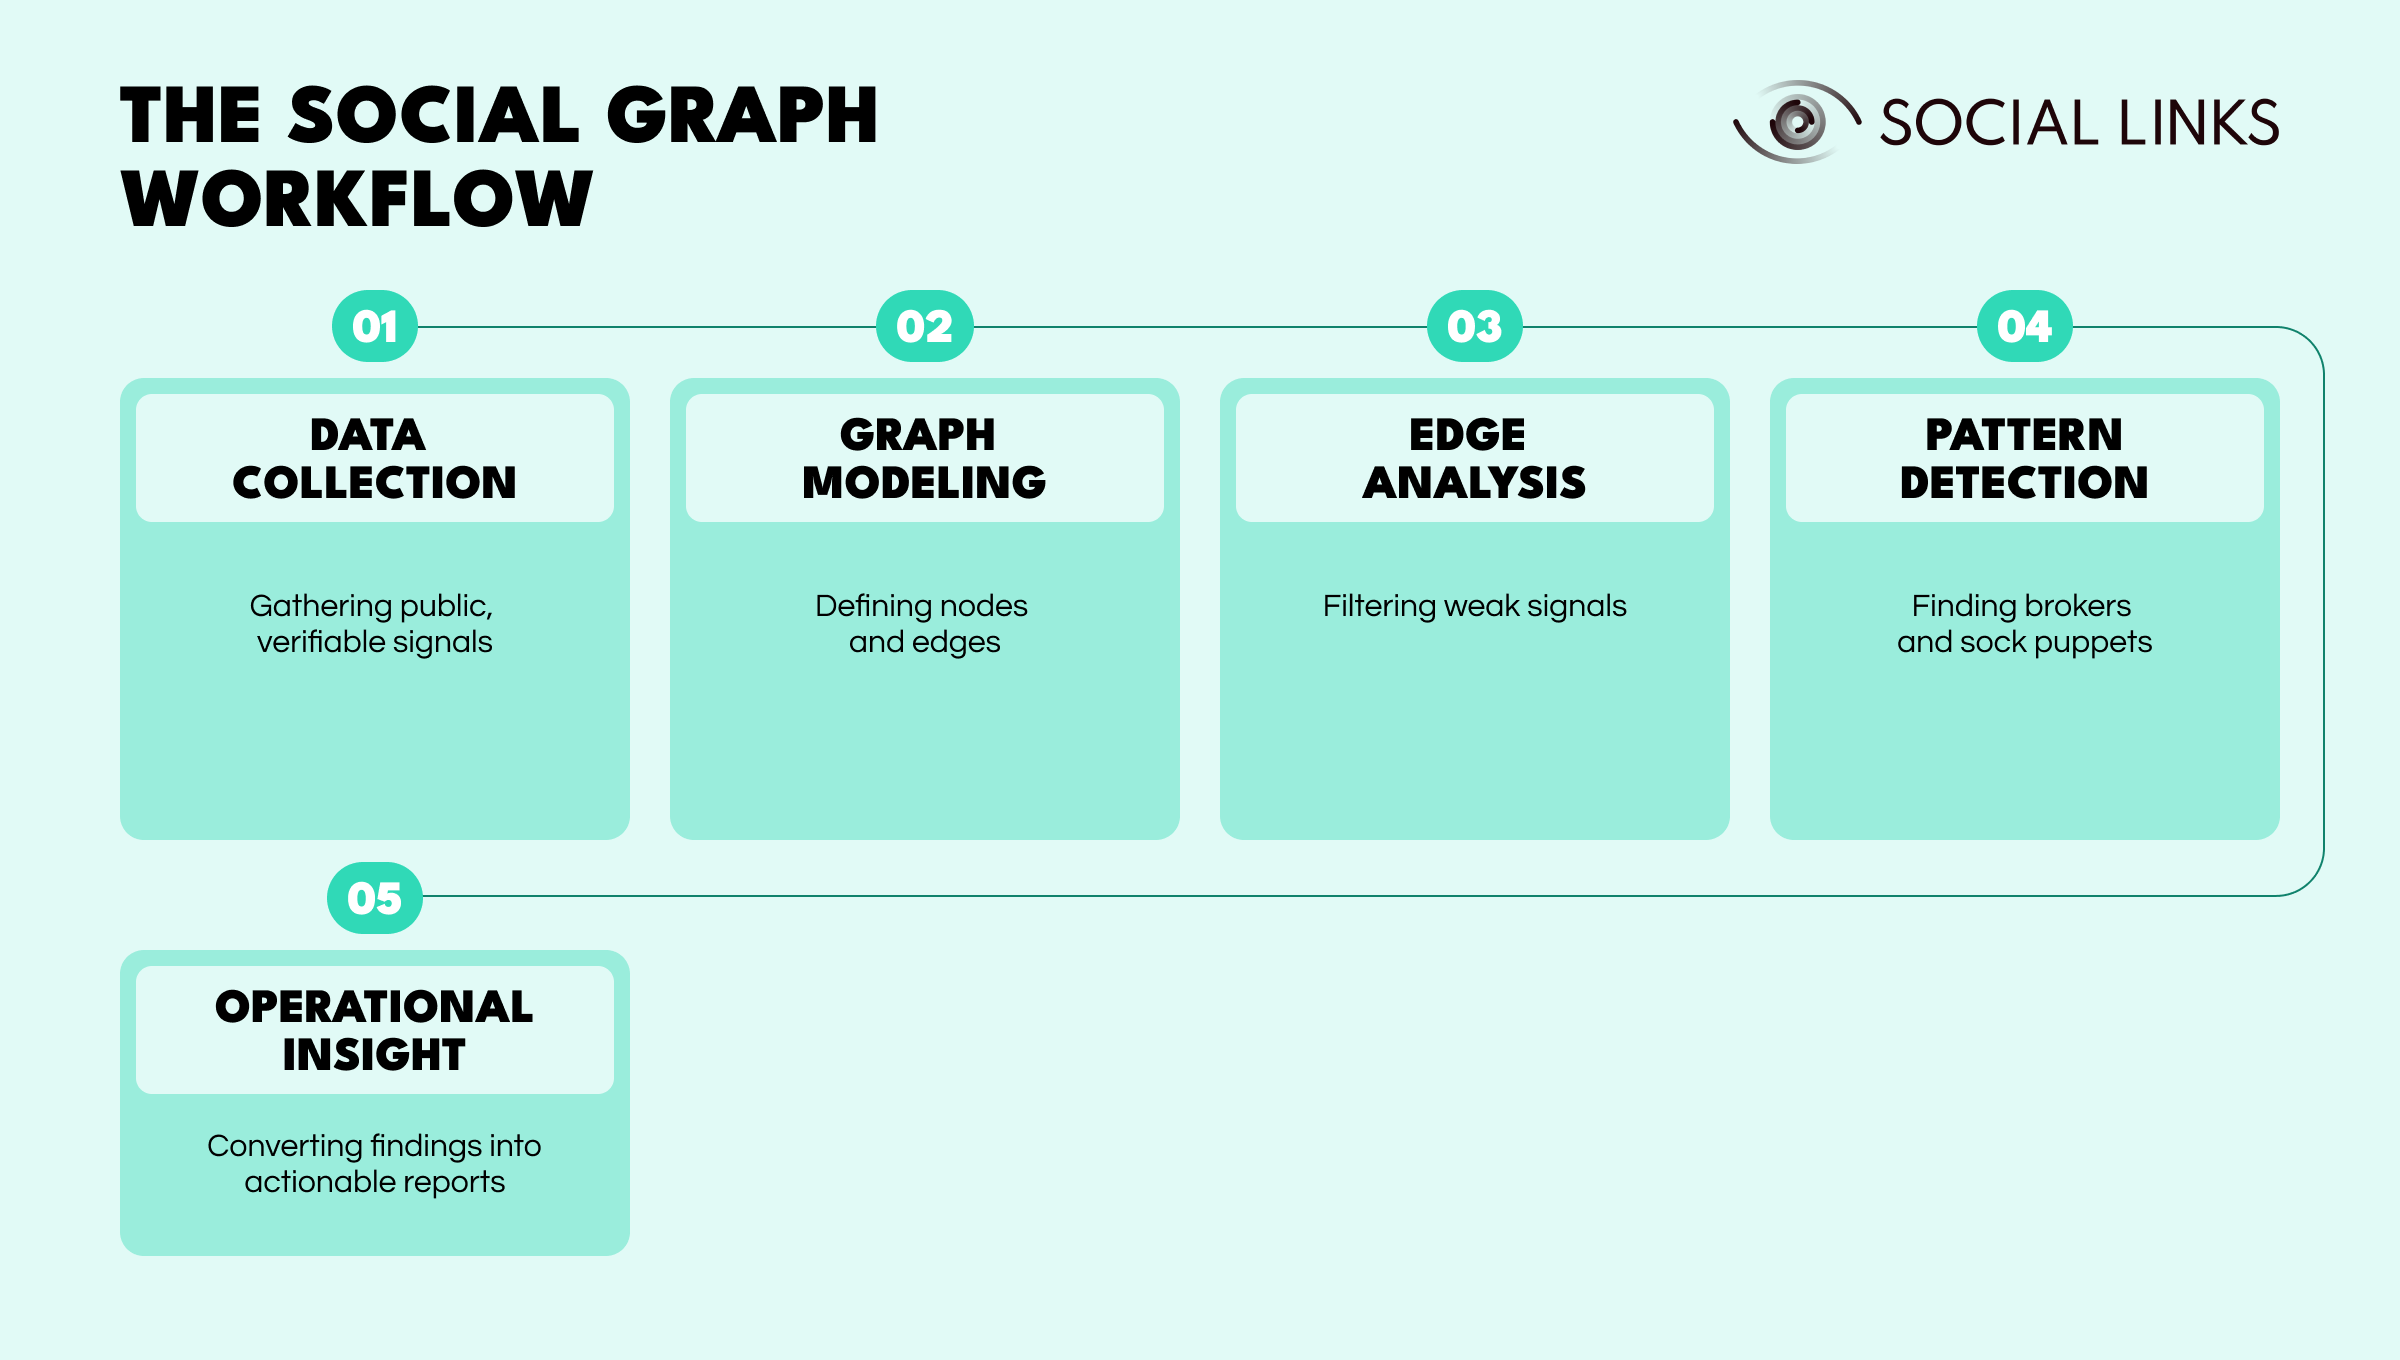
This article explains how social graph analysis transforms digital activity into actionable intelligence. It walks through each stage—data collection, modeling, and analysis—showing how investigators use graph social media methods to uncover hidden connections, identify broker accounts, and expose the networks driving digital influence and disinformation.
A social graph is not about collecting everything; it’s about mapping what matters. Think of it as a specialized knowledge graph focused on online behavior. In a knowledge graph, nodes represent entities such as people or organizations, and edges represent relationships such as works for or owns. The same logic applies here—but instead of using corporate facts, analysts connect social network entities such as personas, domains, and infrastructure.
A defensible, intelligence-ready graph includes:
And remember that precision trumps scale—ten accounts posting identical content across multiple social media channels tell a clearer story than thousands of random likes.
Every node and edge should come from a verifiable, public source. The goal is to capture meaningful interactions while respecting platform Terms & Conditions as well as privacy boundaries.
Pro Tip: Start with verified selectors (known domains, handles, or organizations) and expand from there gradually. It’s the level of precision that will determine how credible your network is.
A social graph consists of nodes (entities) and edges (relationships). Every edge should carry meaning, context, and evidence.
By modeling actively and with focus, you can defend every connection rather than simply relying on visual complexity.
Edges form the investigative backbone. Since weak or coincidental links distort conclusions, analysts focus on high-confidence relationships that represent credible coordination.
Avoid superficial connections such as “liked same video”. Real threat intelligence comes from behavioral consistency, not coincidental actions.
A well-structured graph makes effective pattern recognition possible, revealing how influence, deception, or coordination emerge across social media platforms.
Broker Hunt. Identify key accounts that bridge separate communities. Such “brokers” can often amplify campaigns and help you maintain coordination across the graph. When one disappears, another often fills the gap.
Sock Puppet Detection. Highlight duplicate or fake accounts through the identification of content similarity and mirrored posting patterns. Merge them into a single “persona family”.
Seed Expansion. Begin with one verified account, then expand your graph from there by deploying confidence-ranked connections. This will help you avoid noise.
Storyline Tracking. Track how hashtags or memes move through timelines and news feeds to map cross-community handoffs.
Infrastructure Handoff. Move away from mere content to coherent infrastructure. When unrelated accounts share a Google Analytics tag or SSL certificate, you’ve found an operational link.
A social graph becomes intelligence when it creates context and clarity—a story that decision-makers can trust. Here are some tools you can deploy to help you construct a compelling narrative:
While monitoring public chatter ahead of a rally, you flag posts within a five-mile radius mentioning “protest” or “attack” with negative sentiment. A platform such as Crimewall instantly surfaces the post, maps the author’s social graph, and identifies links to extremist clusters. This integration of sentiment and social graph intelligence transforms overwhelming data into a single actionable signal.
Social graphs have the power to turn online chaos into connected, comprehensible structure. It helps analysts trace influence, detect coordination, and anticipate emerging threats. And when it comes to threat intelligence, the goal of social graphing is not merely to collect everything but to interpret how people, accounts, and organizations connect.
When combined with tools like sentiment analysis or infrastructure mapping, the social graph becomes the connective layer that unites multiple intelligence streams into one coherent picture.
A social graph maps how entities connect and interact across social media platforms. It helps investigators visualize relationships, track influence, and detect coordinated behavior in real time.
A knowledge graph maps facts like “A is CEO of B.” A social graph maps behavior—for example, “A shares content from B”. Understanding how a knowledge graph works helps analysts model structured data more effectively.
The Facebook social graph reveals public groups, events, and mutual interactions, while the X (Twitter) social graph shows narrative flow through retweets and replies. Both are vital for mapping coordination and reach.
The LinkedIn social graph connects organizational data such as role changes or mutual affiliations, which are useful for mapping networks and identifying coordinated hiring or insider links.
The Google social graph (and Knowledge Graph Search API) helps discover entities and related pages, but it doesn’t map interpersonal links. It should be used to enrich selectors, not replace human-driven social network mapping.
Want to see how integrated OSINT tools can transform the way you map and analyze digital networks? Book a personalized demo with one of our specialists and explore how Crimewall unifies social graph intelligence, sentiment tracking, and infrastructure mapping—all within a single investigative platform.